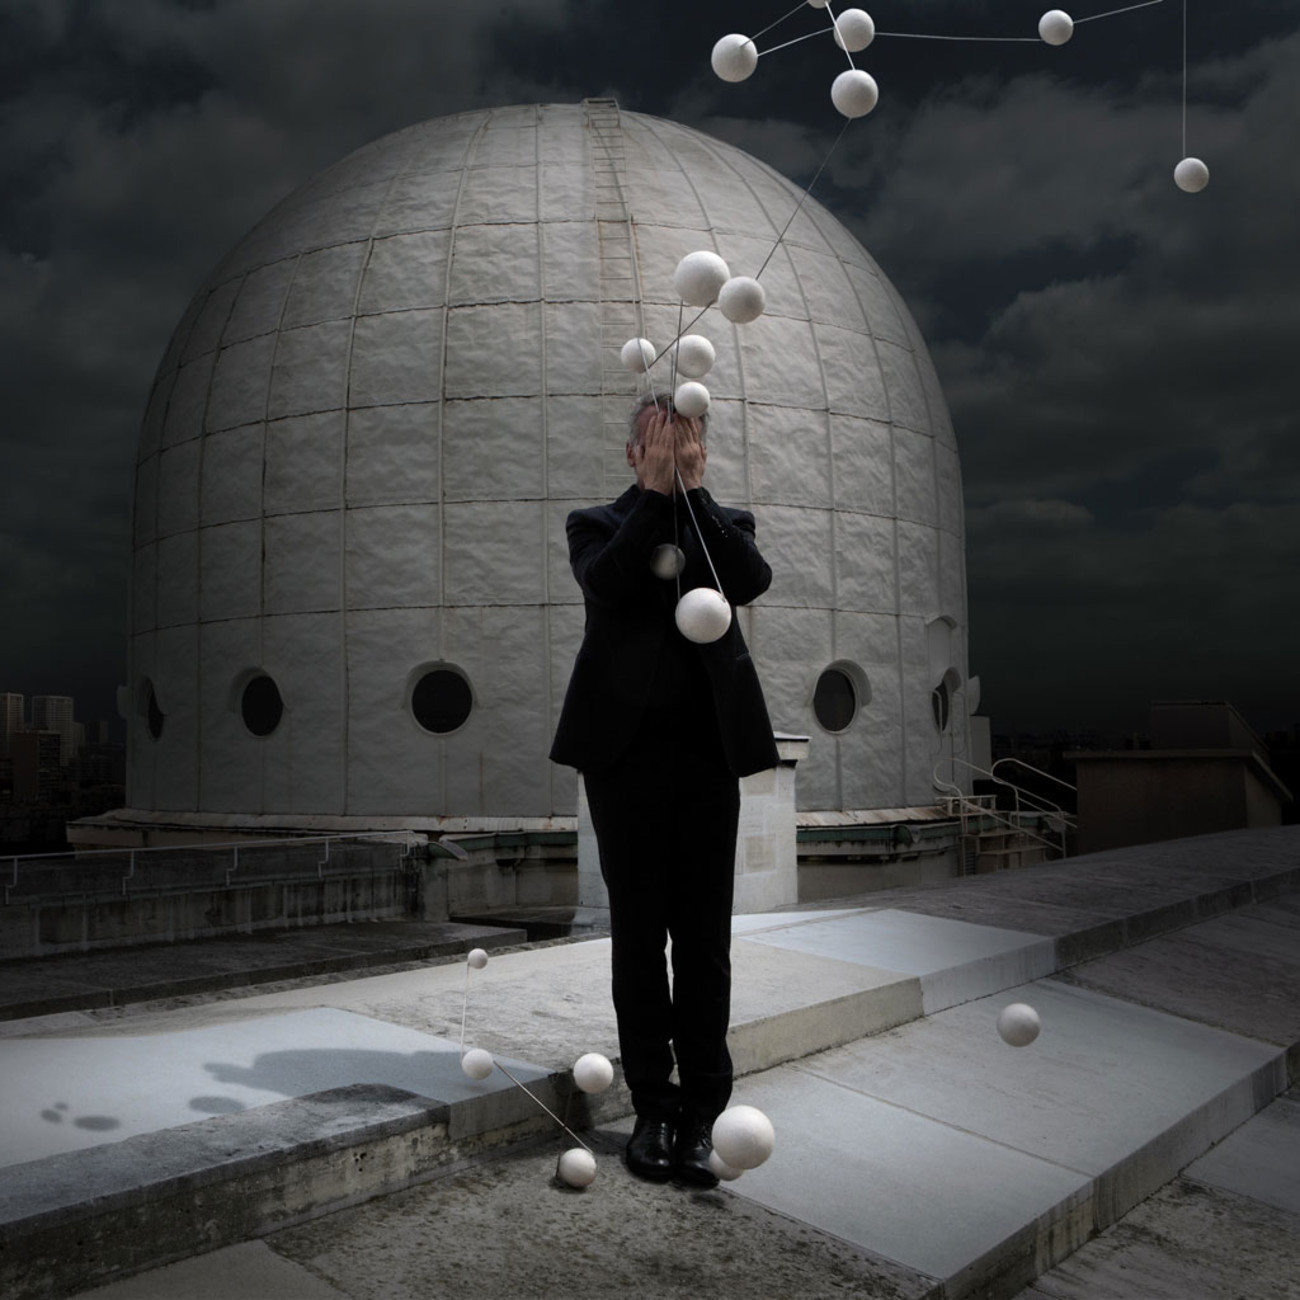
Created in the very heart of the scientific community, Aurélie Colliot’s project constitutes a search for “simplexity” through graphism, which, in the manner of a translator, transposes and integrates the novice in complex systems. Computational instruments, data-saving instruments, the purpose of the series of astronomical tools that can be manipulated emerges with their use, so that their manipulator is an essential ingredient for their understanding.


, période de révolution : 10 747 jours")


Astronomie graphique
The scientific community has its own ambivalence, that of communicating its knowledge while at the same time simplifying it. It is an unfortunate fact, often reiterated by the scientists, that this knowledge is thereby often diluted and impoverished, sometimes to the point of losing its essential content.
Astronomy, the study of cosmic events and the evolution of our Universe, is a fascinating subject. The dizziness engendered in us all by astronomical data is related to the infinitely large but intangible values of the Universe.
The purpose of the research carried out is to understand the Universe, and to put together the tools needed to share astronomical and other data.
Scientific popularization, in graphic form, is not easily followed by the general public. Mathematical and geometrical representations are not easily assimilated by the general public, and are understandable essentially by professional scientists. Their complete reading becomes elitist for scientists, superficial by the amateur public.
This project is thus a graphical simplification. Design becomes the handmaiden of complexity. Graphical design plays the role of translator for the beginner.
“To understand Man, one must first situate him in the Universe, and not subtract him.” Edgar Morin, Les sept savoirs nécessaires à l’éducation du futur, 2000.
The Universe as a laboratory
But how can one touch what is around us, what dominates us, what invades us? One must communicate to learn and to teach. Transform the novice from being an ordinary participant into an actor, integrate him into the communication procedure and restore for him a place in the celestial whole.
Man at the heart of the structure of the Universe becomes Man at the heart of knowledge.
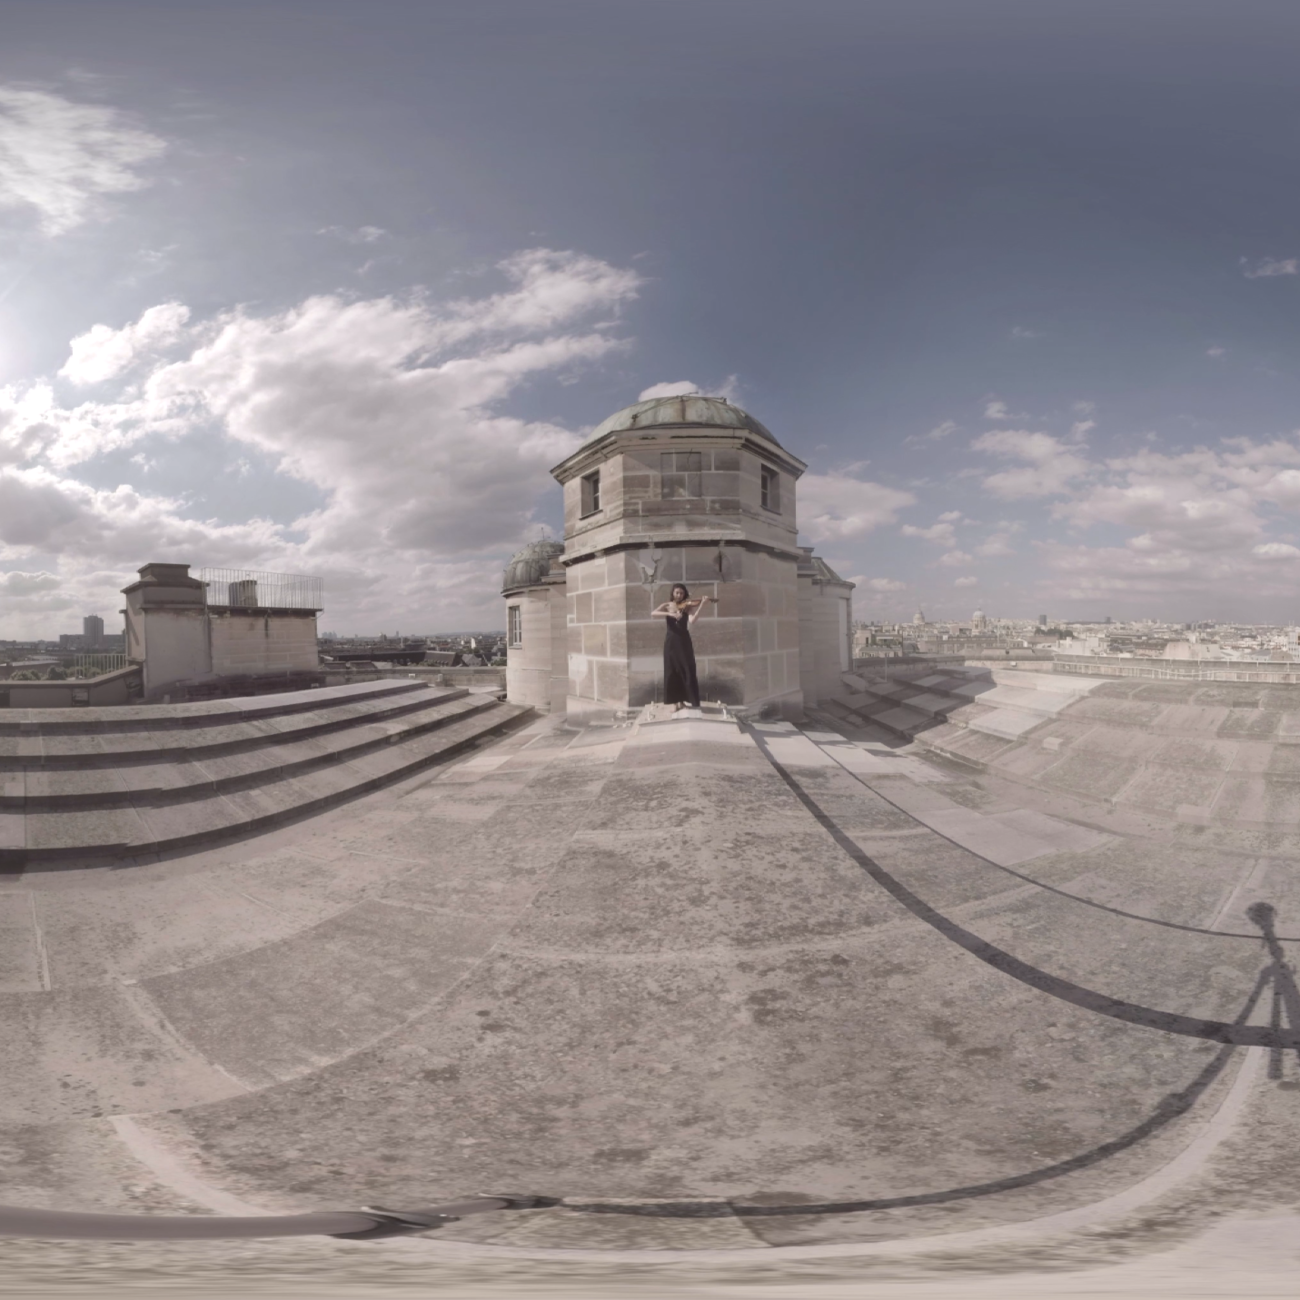
The graphical arts appear as part of a new pedagogy. Already tools for visualization and demonstration, they become experimental tools.
This project is thus a set of manipulative astronomical tools. Destined for calculation and memorization, their essence emerges as they are used, and their user is an essential element for their understanding.